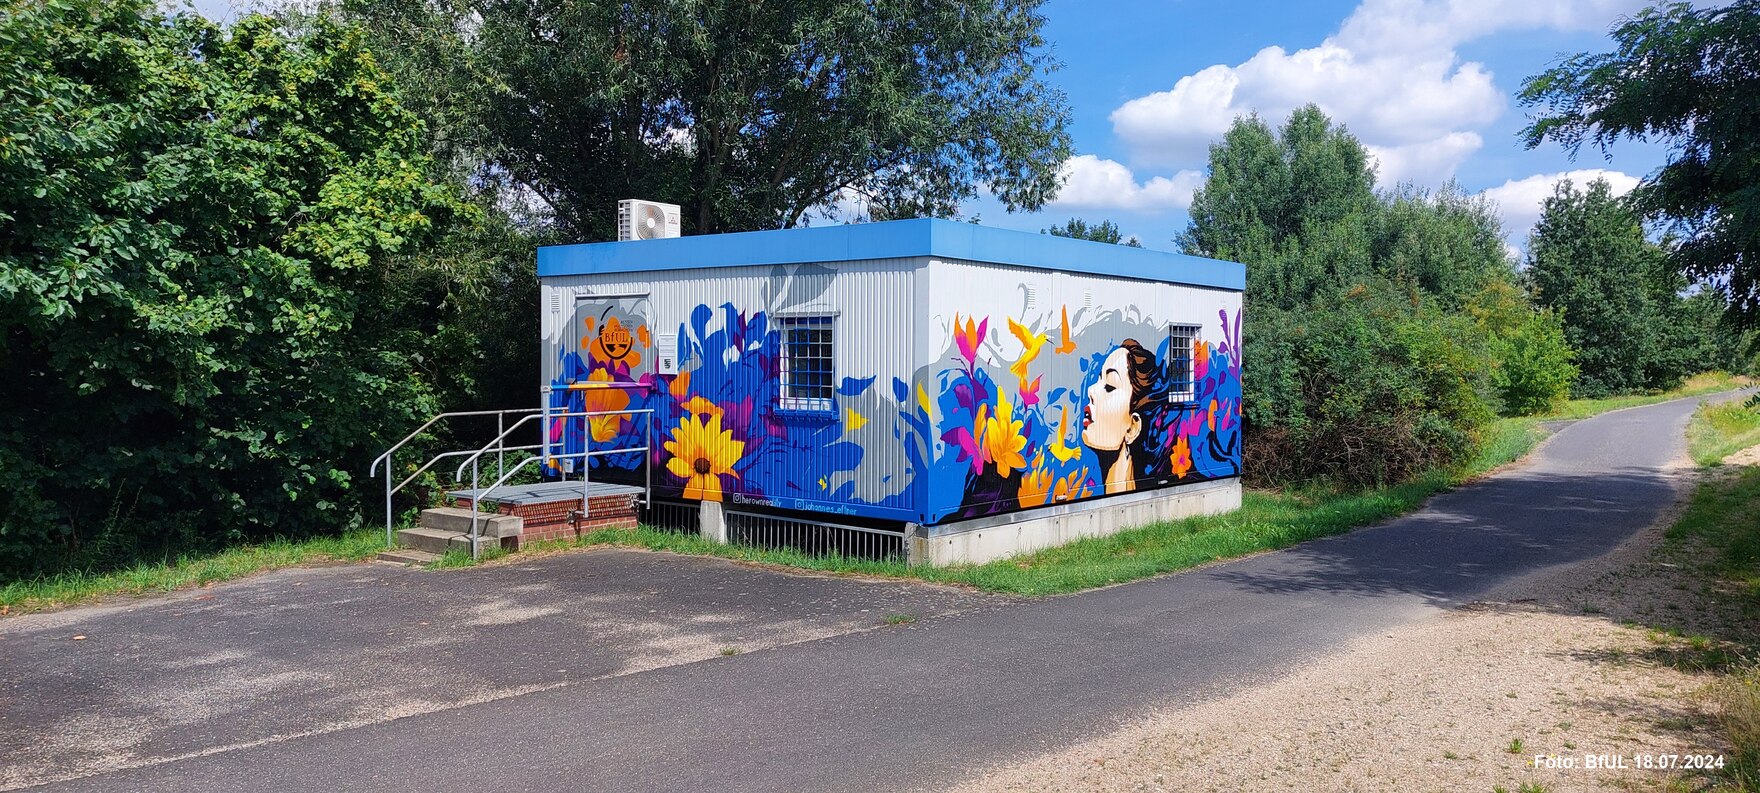
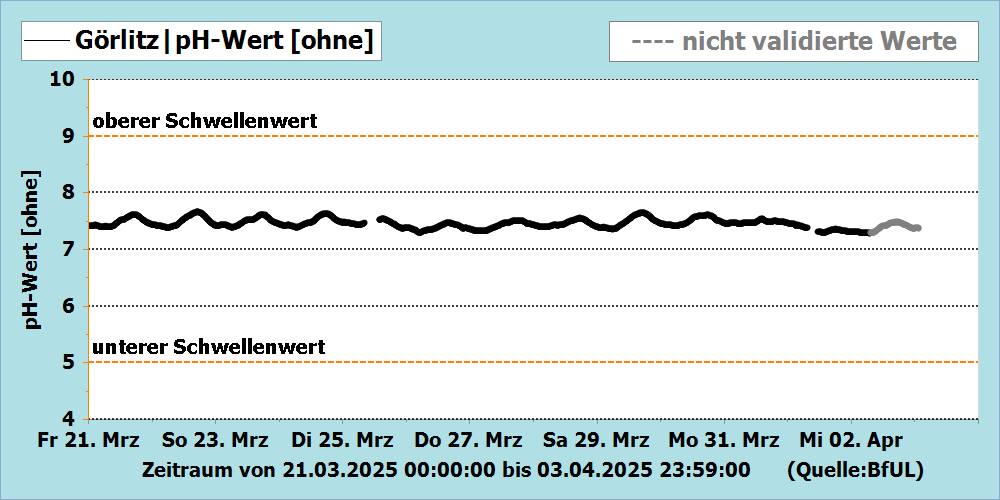
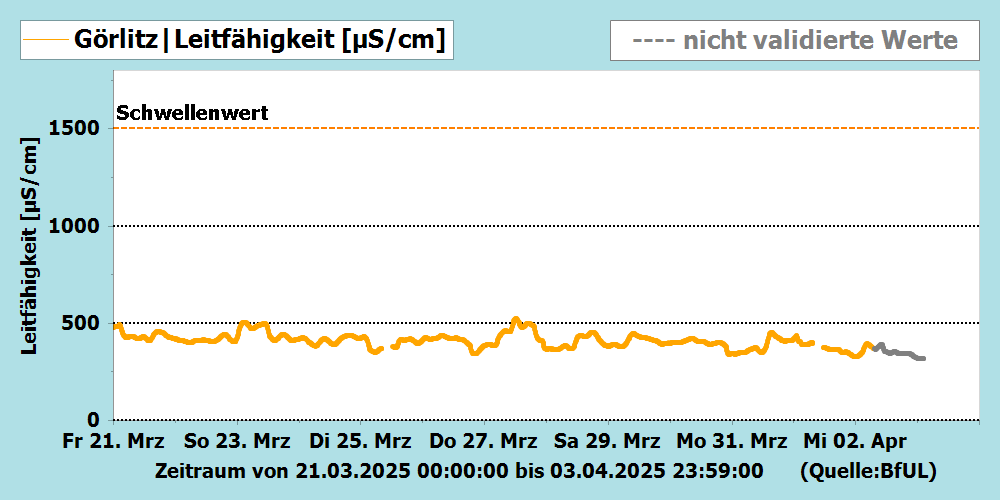
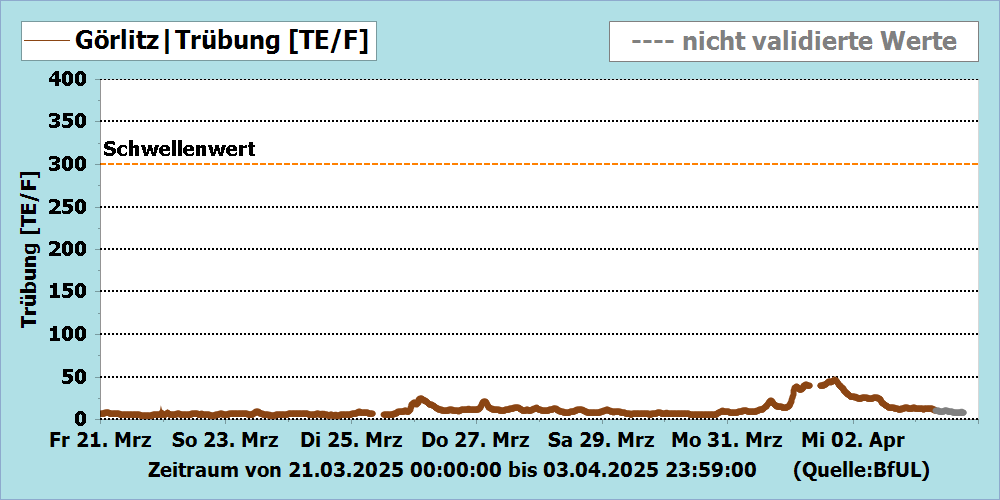
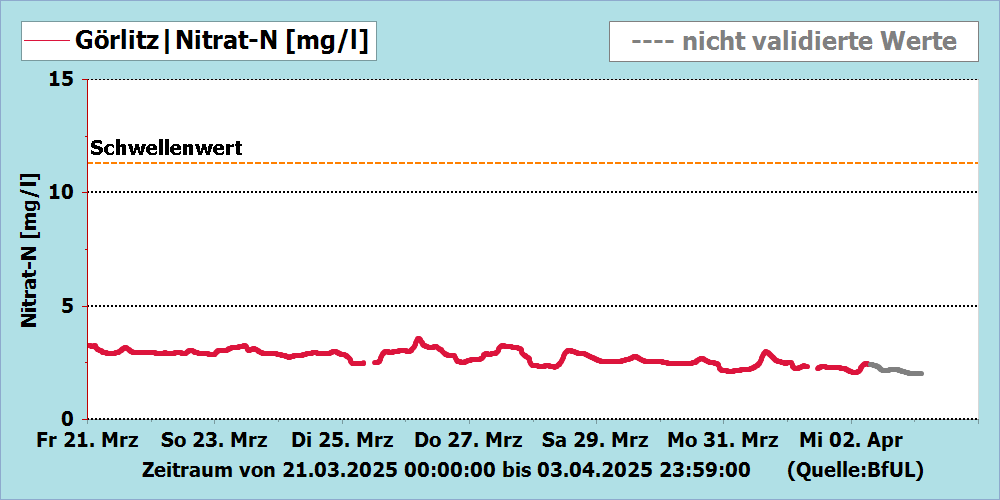
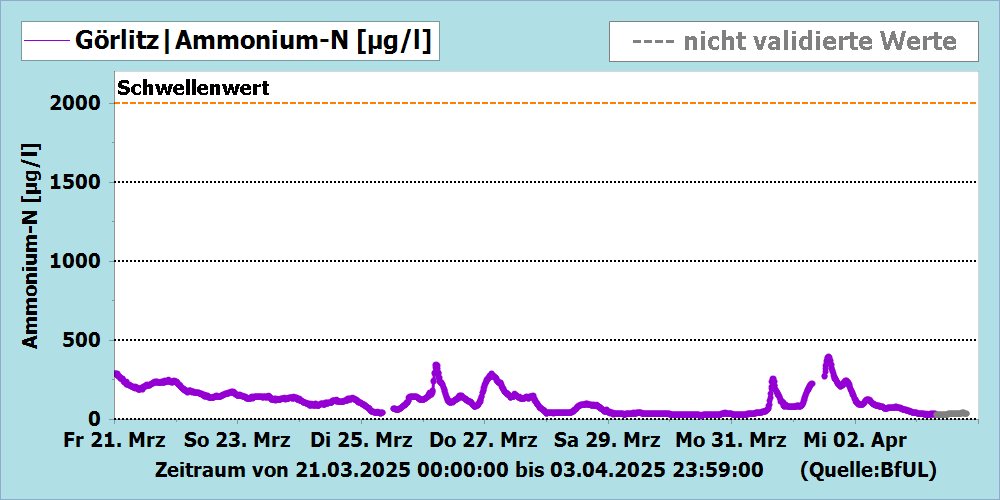
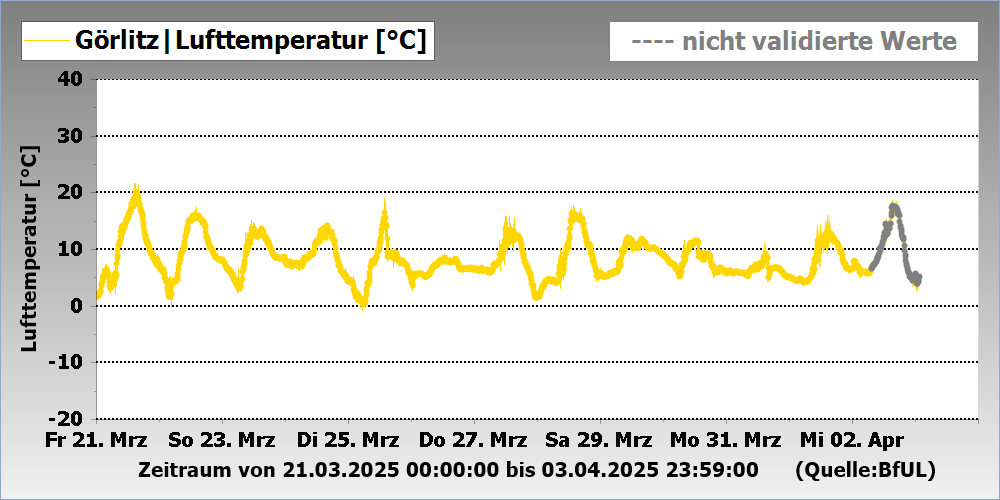
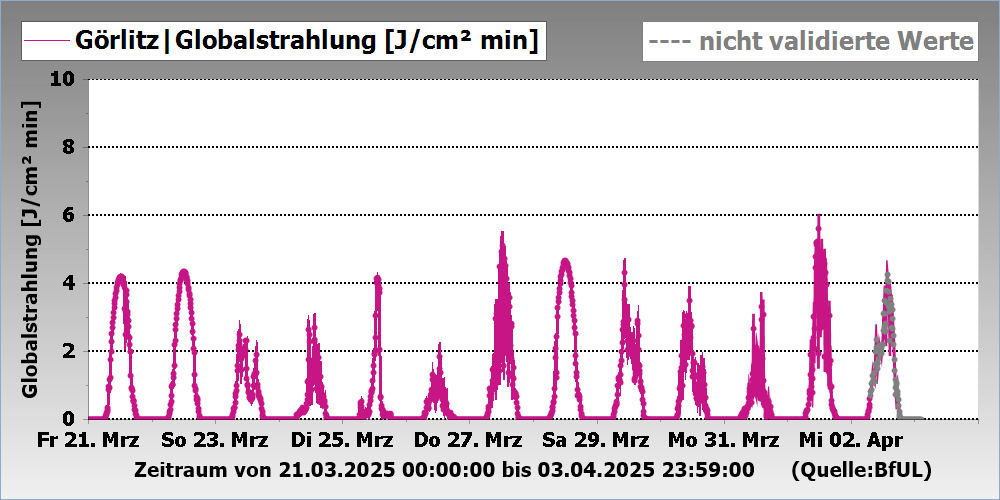
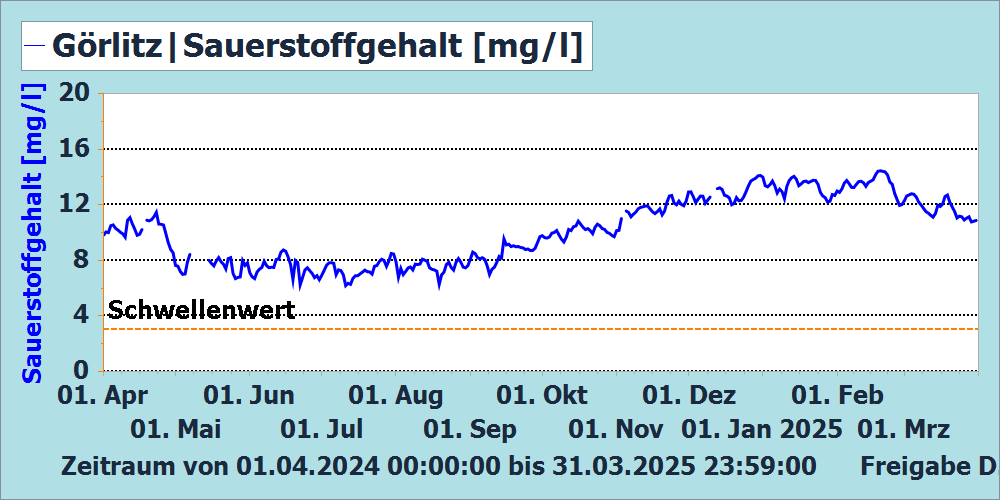
Messstation Görlitz, Lausitzer Neiße links, Fluss-km: 161
 © BfUL

Die Gewässergütemessstation befindet sich flussaufwärts von Görlitz am linken Ufer der Lausitzer Neiße.
Datum der letzten Datenvalidierung:
24.04.2025 06:00 Uhr
Alle Zeitangaben beziehen sich auf die Mitteleuropäische Zeit (MEZ).
Hinweise:
keine
Messwertabelle Görlitz der letzten 14 Tage
- Messwerttabelle Görlitz (*.xls, 0,9 MB) nur validierte Werte
Betriebszeit: seit 1997 durchgehend
Ausstattung:
|
Meteorologische Parameter |
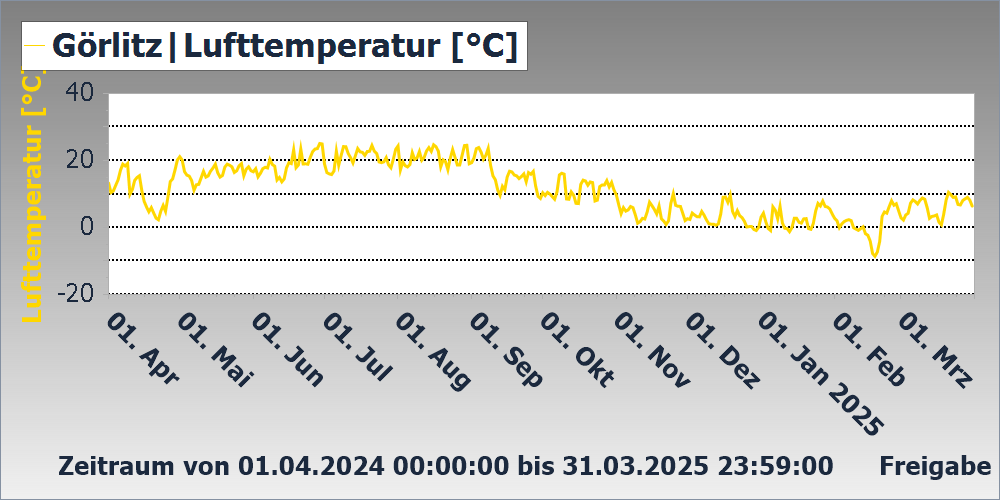
Lufttemperatur |
|
Physikalisch-chemische Parameter |
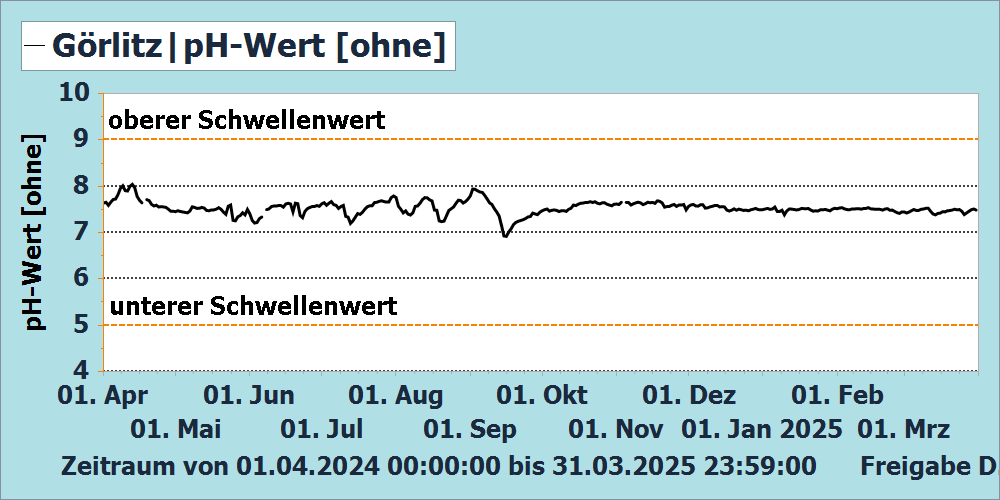
pH |
|
Probennahme |
3 automatische Probennehmer für Wochenmischproben / Ereignisproben |
|
Betriebsinterne Steuergrößen |
Druckmessung Probenwasser |
|
Datenerfassung |
DFÜ in eine zentrale Datenbank |
Hinweise:
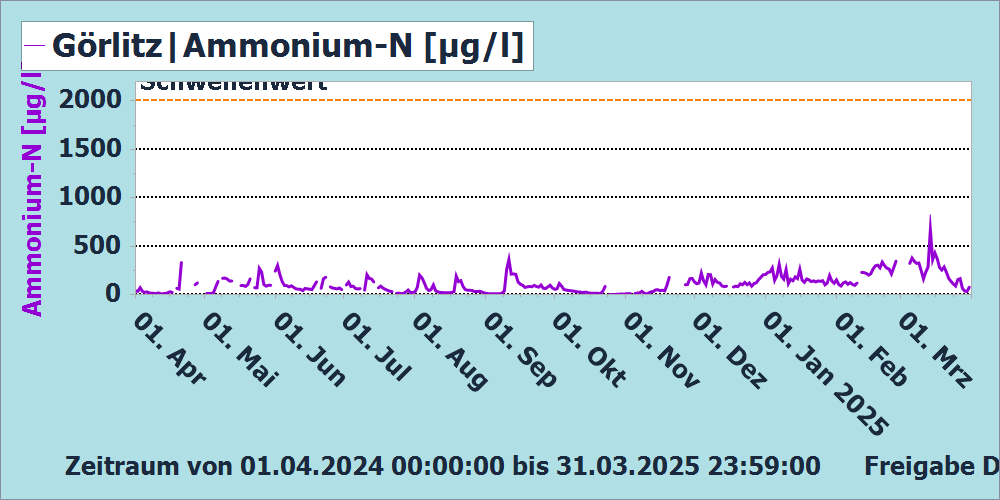
22. bis 26.04.2024 und 29.04. bis 01.05.2024 Gerätestörung Ammoniumstickstoffmessung
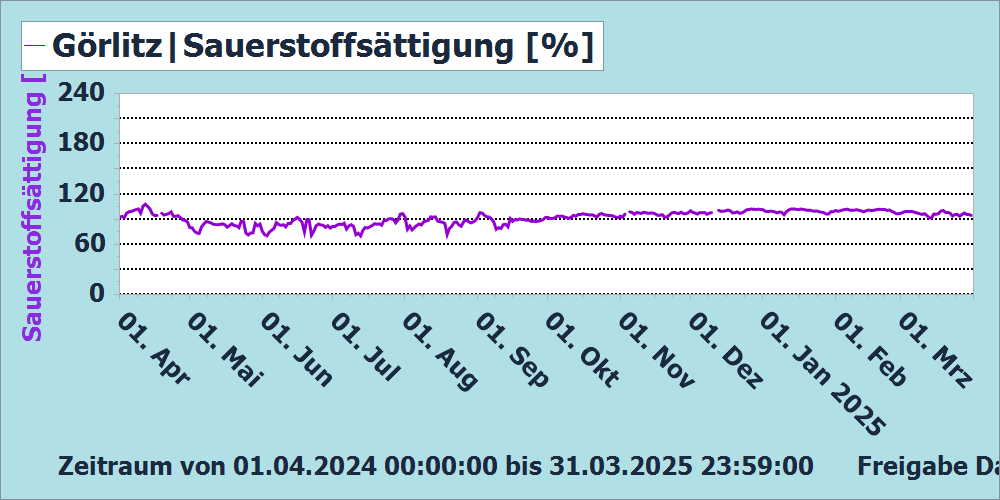
09. bis 13.05.2024 keine Sauerstoffmesswerte durch Datenbankfehler
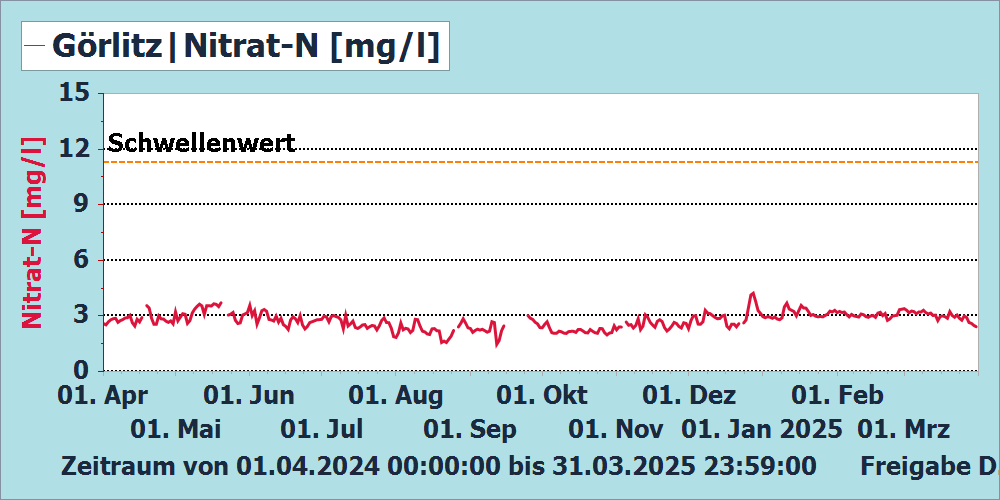
21./22.05.2024 Störung bei Nitratstickstoffmessung
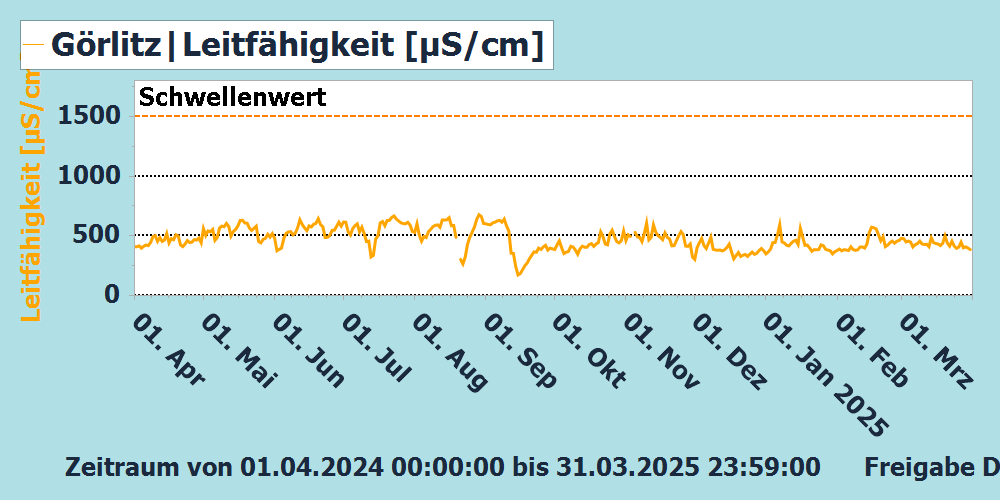
19. bis 21.08.2024 Störung bei Leitfähigkeitsmessung
14. bis 24.09.2024 Strörung bei Nitratstickstoffmessung
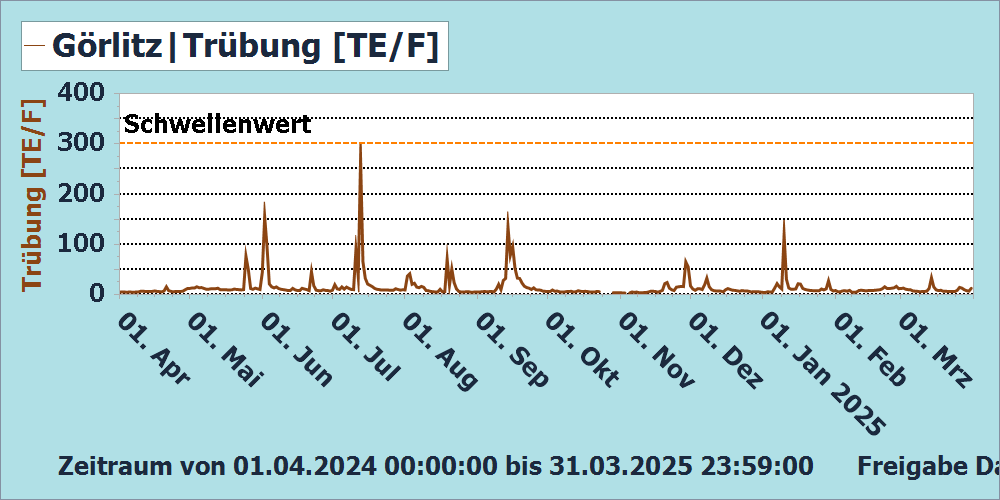
24. bis 27.10.2024 Störung bei Trübungsmessung
21. bis 26.11.2024 Störung Ammoniumstickstoff-Messung
27.02. bis 04.03.2025 Störung Ammoniumstickstoff-Messung
Bearbeitungsstand 02.04.2025
Messwertabelle Görlitz der letzten 365 Tage
- Grafische Darstellung 2024 (*.pdf, 0,24 MB)
- Messwerttabelle 2024 (*.xlsx, 51,06 KB)
- Grafische Darstellung 2023 (*.pdf, 0,22 MB)
- Messwertabelle 2023 (*.xlsx, 59,07 KB)
- Grafische Darstellung 2022 (*.pdf, 0,24 MB)
- Messwerttabelle 2022 (*.xlsx, 57,47 KB)
- Grafische Darstellung 2021 (*.pdf, 0,27 MB)
- Messwerttabelle 2021 (*.xlsx, 57,77 KB)
- Grafische Darstellung 2020 (*.pdf, 0,28 MB)
- Messwerttabelle 2020 (*.xlsx, 66,20 KB)
- Grafische Darstellung 2019 (*.pdf, 0,10 MB)
- Messwerttabelle 2019 (*.xlsx, 52,11 KB)
- Grafische Darstellung 2018 (*.pdf, 0,11 MB)
- Messwertabelle 2018 (*.xls, 90,00 KB)
- Grafische Darstellung 2017 (*.pdf, 0,10 MB)
- Messwertabelle 2017 (*.xls, 90,00 KB)
- Grafische Darstellung 2016 (*.pdf, 0,10 MB)
- Messwerttabelle 2016 (*.xlsx, 54,42 KB)
- Grafische Darstellung 2015 (*.pdf, 0,17 MB)
- Messwerttabelle 2015 (*.xlsx, 55,73 KB)
- Grafische Darstellung 2014 (*.pdf, 87,49 KB)
- Messwerttabelle 2014 (*.xls, 85,00 KB)
- Grafische Darstellung 2013 (*.pdf, 87,55 KB)
- Messwerttabelle 2013 (*.xls, 85,00 KB)
- Grafische Darstellung 2012 (*.pdf, 83,57 KB)
- Messwerttabelle 2012 (*.xls, 83,00 KB)
- Grafische Darstellung 2011 (*.pdf, 38,69 KB)
- Messwerttabelle 2011 (*.xls, 0,11 MB)
- Grafische Darstellung 2010 (*.pdf, 38,58 KB)
- Messwerttabelle 2010 (*.xls, 80,50 KB)
- Grafische Darstellung 2009 (*.pdf, 38,78 KB)
- Messwerttabelle 2009 (*.xls, 96,50 KB)
- Grafische Darstellung 2008 (*.pdf, 49,56 KB)
- Messwerttabelle 2008 (*.xls, 99,50 KB)
- Grafische Darstellung 2007 (*.pdf, 42,66 KB)
- Messwerttabelle 2007 (*.xls, 0,10 MB)
- Grafische Darstellung 2006 (*.pdf, 42,83 KB)
- Messwerttabelle 2006 (*.xls, 97,50 KB)
- Grafische Darstellung 2005 (*.pdf, 40,46 KB)
- Messwerttabelle 2005 (*.xls, 92,50 KB)
- Grafische Darstellung 2004 (*.pdf, 40,49 KB)
- Messwerttabelle 2004 (*.xls, 72,00 KB)
- Grafische Darstellung 2003 (*.pdf, 40,04 KB)
- Messwerttabelle 2003 (*.xls, 66,50 KB)
- Grafische Darstellung 2002 (*.pdf, 39,83 KB)
- Messwerttabelle 2002 (*.xls, 67,00 KB)
- Grafische Darstellung 2001 (*.pdf, 39,60 KB)
- Messwerttabelle 2001 (*.xls, 64,50 KB)
- Grafische Darstellung 2000 (*.pdf, 40,13 KB)
- Messwerttabelle 2000 (*.xls, 67,00 KB)
- Grafische Darstellung 1999 (*.pdf, 39,78 KB)
- Messwerttabelle 1999 (*.xls, 67,50 KB)
- Grafische Darstellung 1998 (*.pdf, 39,90 KB)
- Messwerttabelle 1998 (*.xls, 66,50 KB)